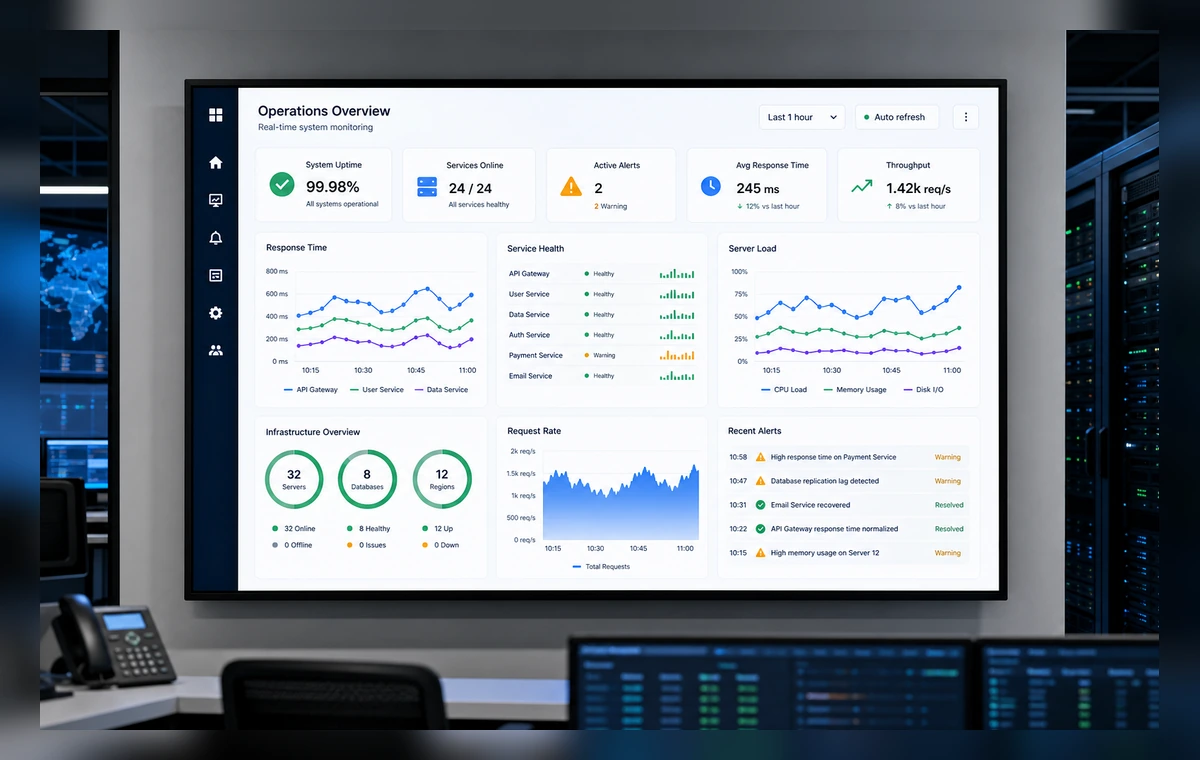
1
Connect Grafana
Open ScreenaAI Console, connect Grafana from Apps & Integrations or Dashboards, and choose the dashboard you want to show.
2
Choose the screen view
Create a screen-ready slide focused on the panels that matter most, such as uptime, latency, throughput, queues, or service health.
3
Publish to TV
Assign the slide to a paired engineering, support, operations, or NOC screen and publish.
Best way to display Grafana dashboard on TV
To display a Grafana dashboard on TV with ScreenaAI, connect Grafana, select the dashboard, review the TV layout, assign it to a paired screen, and publish. For best results, choose a clean dashboard view with large panels and labels that are readable from across the room.
Why teams put Grafana dashboards on TV
Grafana is most useful on shared screens when the information helps people act without opening another tab. ScreenaAI turns Grafana dashboard into a screen-ready view for engineering teams, SRE teams, NOC rooms, support teams, operations leaders.
What to show on the screen
- Service health panels
- Infrastructure dashboards
- Latency and throughput
- Queue depth
- SLO and uptime summaries
AI setup versus manual setup
The AI method is best when you know the outcome, for example, "show our Grafana dashboard on the sales floor TV." ScreenaAI helps prepare the workflow for review. Manual setup is best when you want to choose the exact Grafana content, layout, playlist, and screen yourself.
TV readability checklist
- Use large KPI cards, short labels, and high-contrast charts.
- Avoid dense tables and tiny filters unless the screen is close to viewers.
- Review the slide before publishing so the Grafana screen is understandable from the room.
- Keep shared-screen content appropriate for the audience and location.
Quick answer
If someone asks how to display Grafana dashboard on TV, the shortest answer is: connect Grafana in ScreenaAI, choose the Grafana dashboard, review the TV layout, assign it to a paired screen, and publish.
How do I display a Grafana dashboard on TV?
Connect Grafana in ScreenaAI, choose the dashboard, create a TV-ready slide, assign it to a paired screen, and publish.
Can Grafana dashboards be shown on office screens?
Yes. ScreenaAI helps turn Grafana monitoring dashboards into shared screens for engineering, support, and operations teams.
What Grafana panels are best for TV?
Service health, latency, uptime, traffic, queues, and incident context panels usually work best on shared displays.
Can AI set up a Grafana TV dashboard?
Yes. Describe the Grafana screen you want, then review the AI-prepared slide before publishing.